Grades:
9th Grade
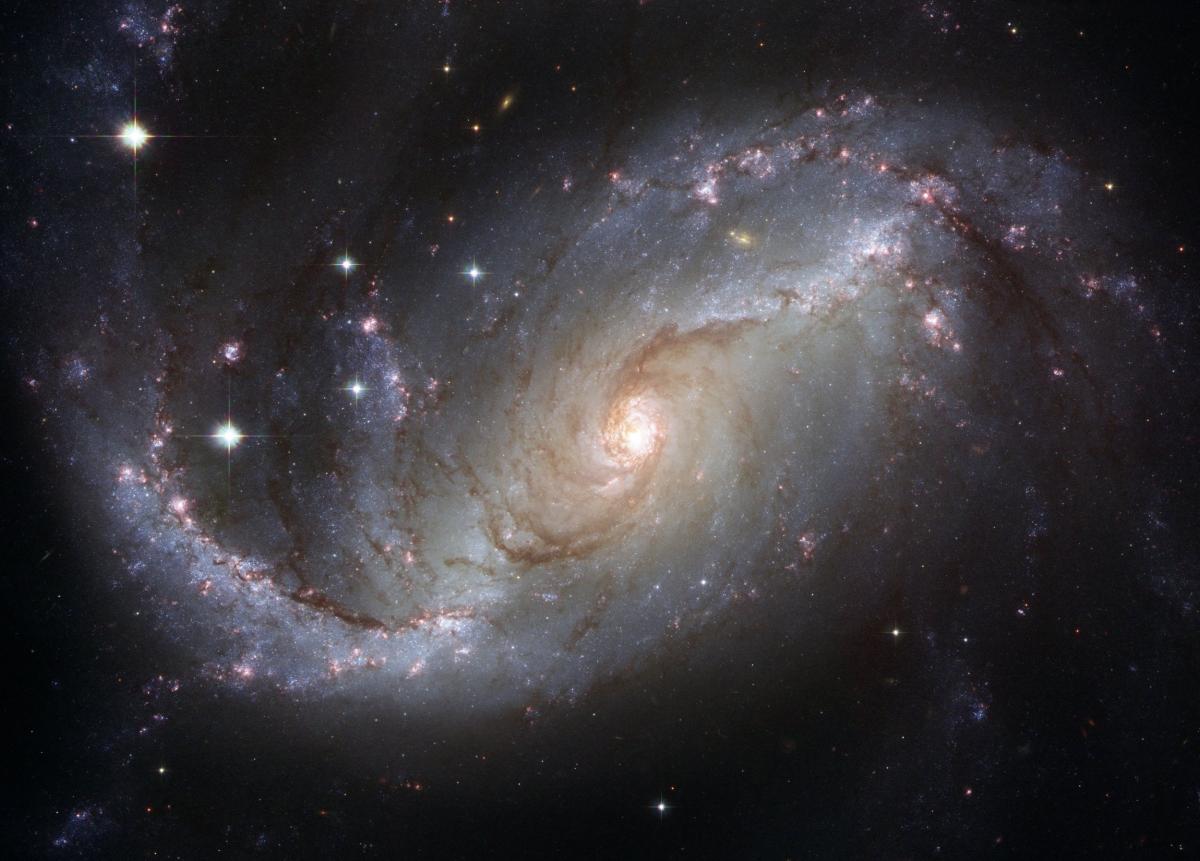
In this lesson students will be able to create an identified x and y-axes and be able to plot how stars fit onto the diagram. Stars have properties (listed within the activity) and will fit into the
In this lesson students will be able to create an identified x and y-axes and be able to plot how stars fit onto the diagram. Stars have properties (listed within the activity) and will fit into the
Students will create a "football" to practice kicking accuracy. They will collect data and create a graph showing their results. After students will learn about a kicker's role in the NFL, what a

In this project, 8th-grade students will engage in hands-on exploration of elastic potential energy and its conversion to kinetic energy using small catapults. Through experimentation and data
This is a continuation lesson in which we compare student data to the previous day's data using GeoGebra to help us generate dot plots and calculate statistics.

Using my backyard chickens as inspiration, this 5th grade lesson asks children to graph egg production and build a model of a chicken coop and run.

After listening to Edwina The Dinosaur Who Didn't Know She Was Extinct, students will explain how Reginald Von Hoobie Doobie reacts to events in the story by creating a Behavior-Over-Time Graph and
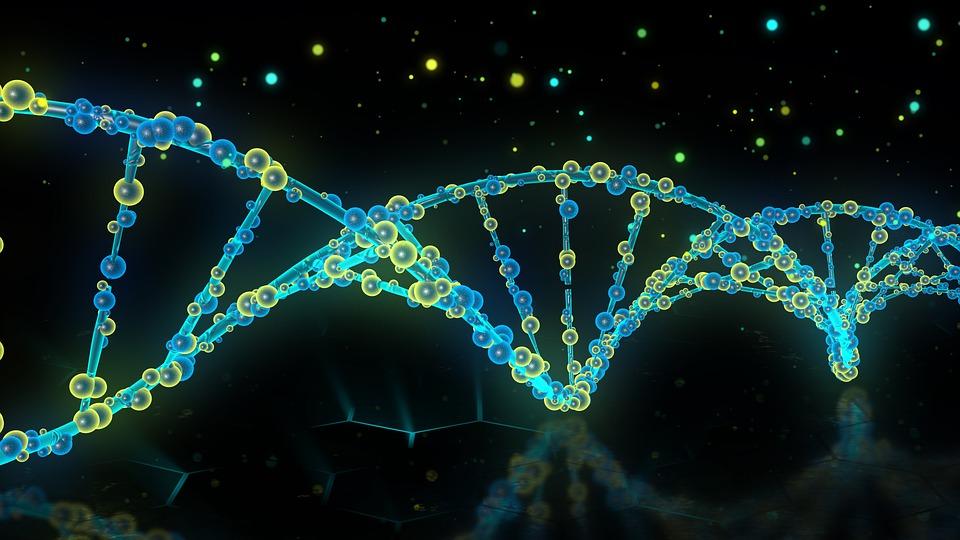
This two day genetics mini unit will take students through observations of cats and their own physical characteristics. Students will graph data and potentially create a bar graph to reflect their
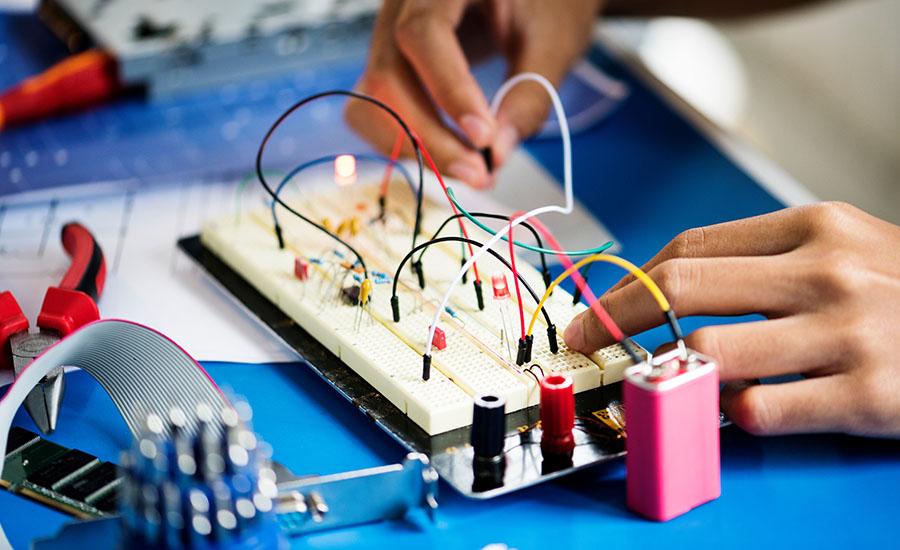
In this lesson, students use a pHet simulation to derive Ohm's law. Students will be able to describe Ohm’s law with a formula and through written expression.
Students will use evidence from an investigation to model and explain how thermal expansion of land and sea ice impact the sea level. They will quantify the impact of land ice melt and thermal