Grades:
1st Grade
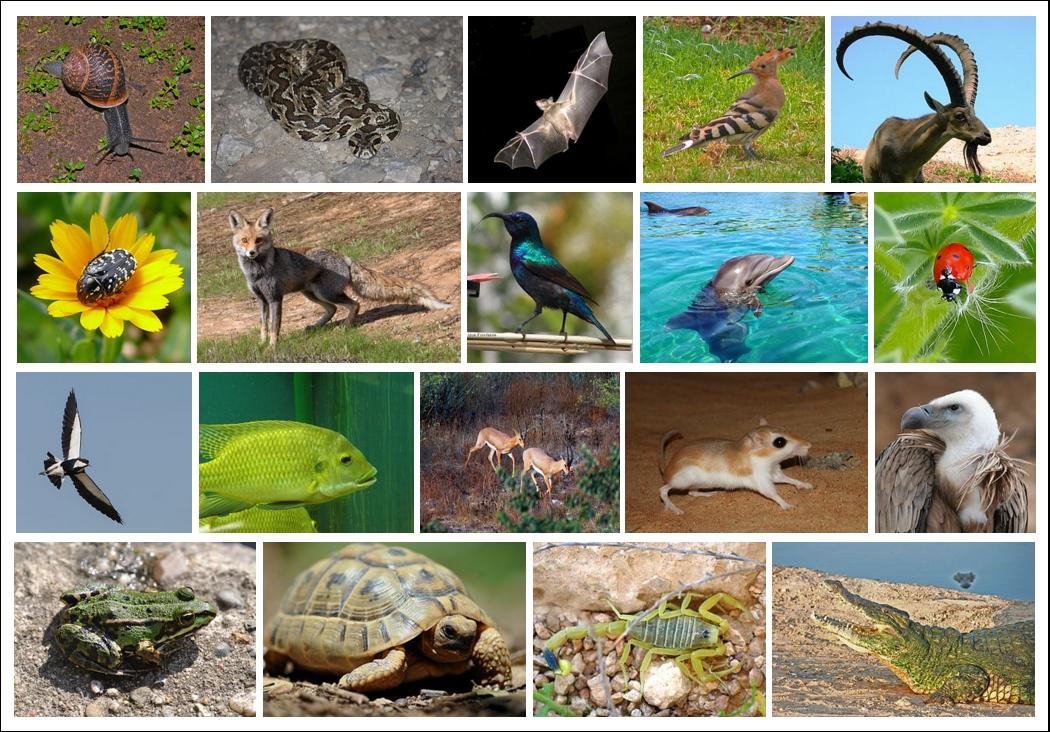
In this lesson, students will learn about and discuss the life cycle of a butterfly. They will then get 10 shapes total from the teacher (circles and squares). They will use their math skills to make
In this lesson, students will learn about and discuss the life cycle of a butterfly. They will then get 10 shapes total from the teacher (circles and squares). They will use their math skills to make
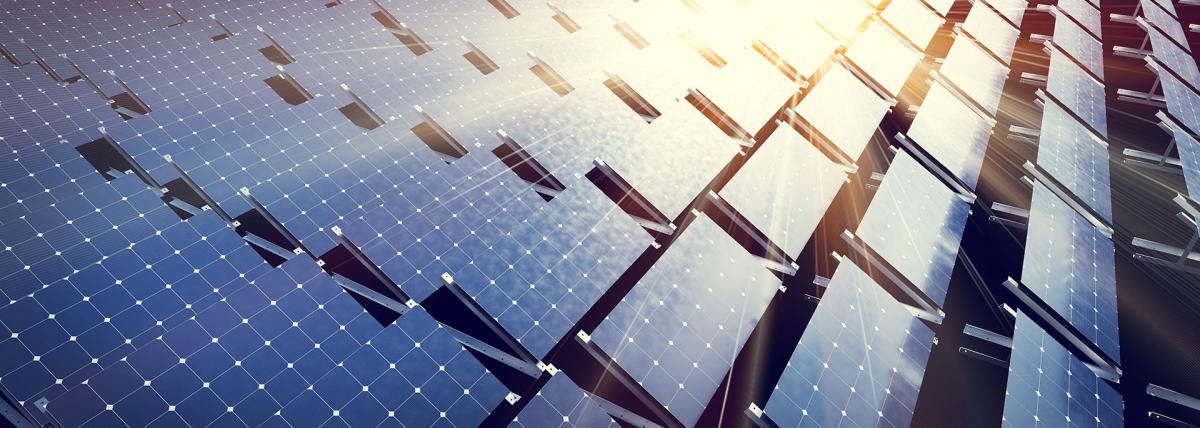
This investigation provides a fun and engaging way for students to learn about data collection, graphing, and proportional relationships while exploring the power of renewable energy. By applying
Students will use empty soda bottles and a heat lamp to model the greenhouse effect that is essential for life on Earth. They will collect data and use it to create a graph of their findings.
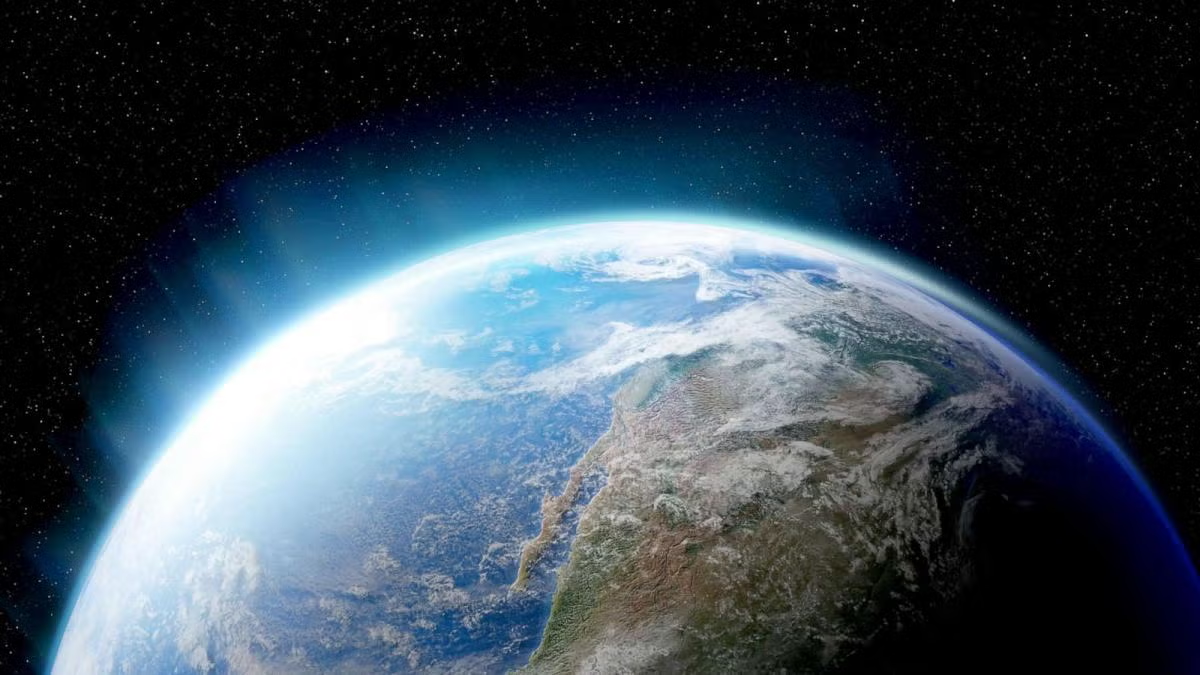
In this lesson, students use the Kepler’s Laws PhET Simulation to collect data on the period and average radius of the planetary orbits. They graph and analyze that data to derive Kepler’s 3rd Law.
In this engaging lesson, students explore the concept of position (Hayu') vs. time (nkez) graphs through a hands-on car motion (Buggy) activity. Using the Buggy on a marked track, students measure and
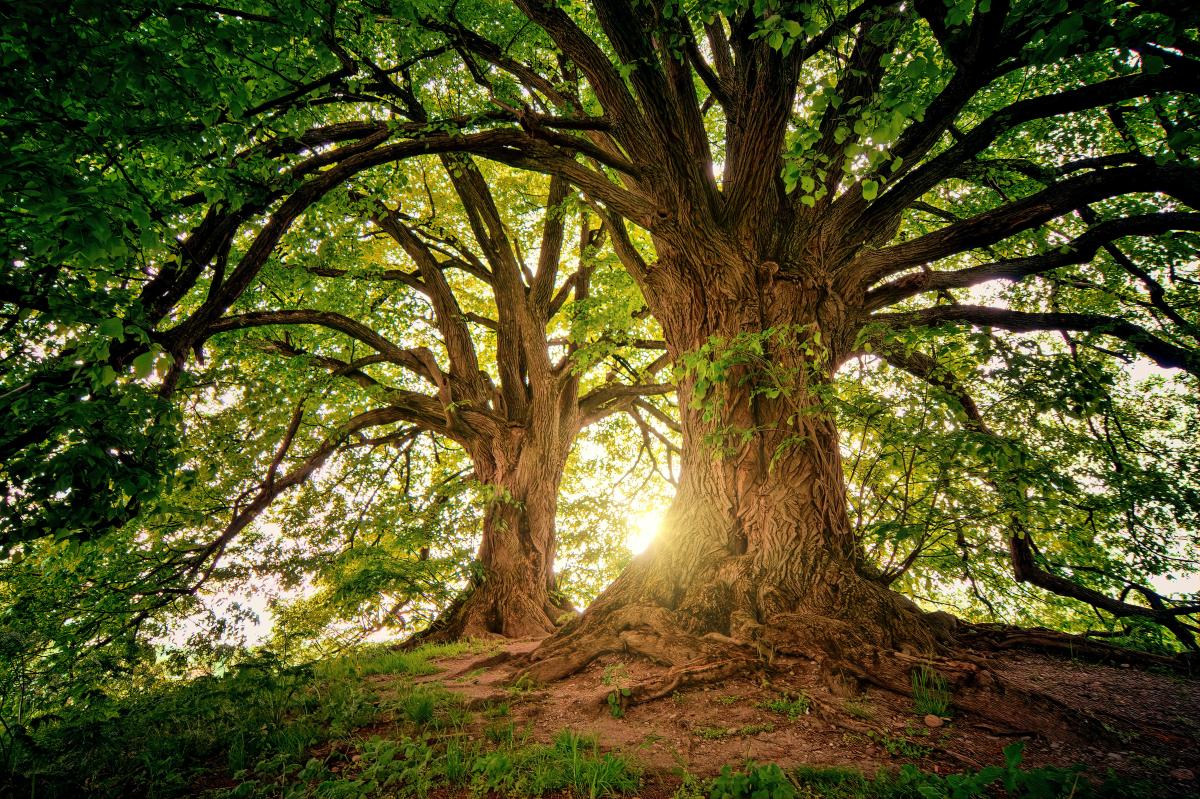
In this lesson series, students engage with the process of photosynthesis to examine factors that can influence the gases produced. In this lesson, students integrate previous lessons observations
In this lesson series, students engage with the process of photosynthesis through making observations and processing data through the collection and measurement of gases. Students will integrate data
In this lesson series, students will explore the process of photosynthesis by collecting data through measurements. Student previously engaged with an experimental lab setup for gas collection, and
In this lesson, students engage in exploration of making observations of photosynthesis and collect gases associated with the process. In this lesson, students will build experimental set ups and