
Graphing Daylight
by Melissa Hall
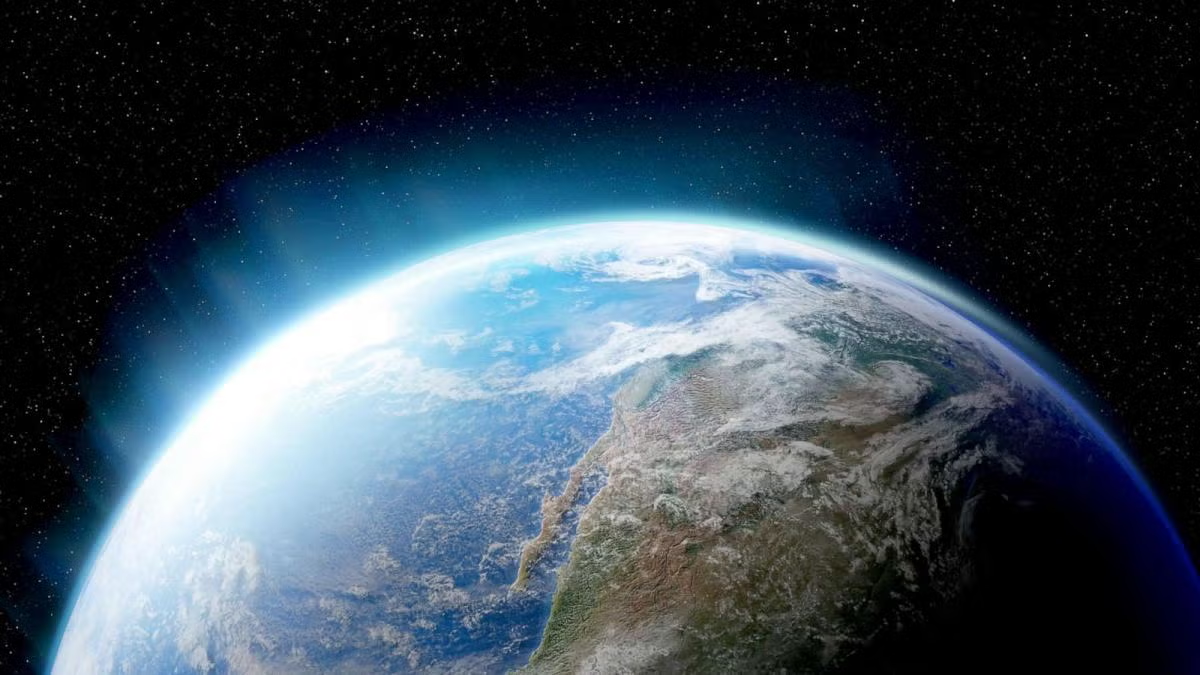
In this engaging lesson, students will use an online seasons simulation to explore how direct and indirect sunlight influence the seasons. They will graph daylight hours from cities located in different parts of the world using Google Sheets. Students will then analyze this data and look for patterns based on the location of the city on the globe.
Lesson Grade Level
6th GradeLesson Plan Link/URL
https://docs.google.com/presentation/d/1NWKneD4llibBZM1oeW7SmAXBf1gOhZ_h/edit?u…Subject Area
Science Earth and Space Science E2: Earth & the Universe Technology 5. Computational Thinker Mathematics Measurement and Data (MD)
Featured
Off
Related Content
Grades:
Kindergarten, 1st Grade, 2nd Grade
This lesson is designed for K-2 students to explore and understand weather patterns using technology. Over the course of 45 minutes, students will use tablets or computers to gather real-time weather

Grades:
6th Grade
This lesson is a four-day unit lesson that highlights the understanding of the climate, geography, trends in the change of temperature, and the related changes in precipitation in the state. This

Grades:
6th Grade
Students will build and use an anemometer to calculate wind speed and then use the wind speed to determine the affect wind has on temperature and the temperature that you feel (wind chill). Students