
Grades:
8th Grade
Methane emissions are far more potent then CO2 emissions in the short-run in the atmosphere yet this is rarely covered in the media. Students will create a multi-media public service campaign to cover
Methane emissions are far more potent then CO2 emissions in the short-run in the atmosphere yet this is rarely covered in the media. Students will create a multi-media public service campaign to cover

Students examine the relationship between a ball's bounce height and its drop height to see a linear relationship. They then calculate the slope of their data to compare "bounciness" with other groups
Students think about dipping a cube in paint, then count the amount of faces that are painted (either 1, 2, 3, or none) they then make a table with the data and are asked to find any patterns they may
Using Vernier motion sensor technology (not included) students will model their position vs time on Vernier Graphical Analysis.
Students will build the distance formula in a spreadsheet to create a sort of "calculator." Students begin by comparing standard math notation with spreadsheets, then practice programming simple math
In this activity, students will use a table to organize information, create a graph to display data and use the correct labels. Students will also recognize the relationship among the table, the graph
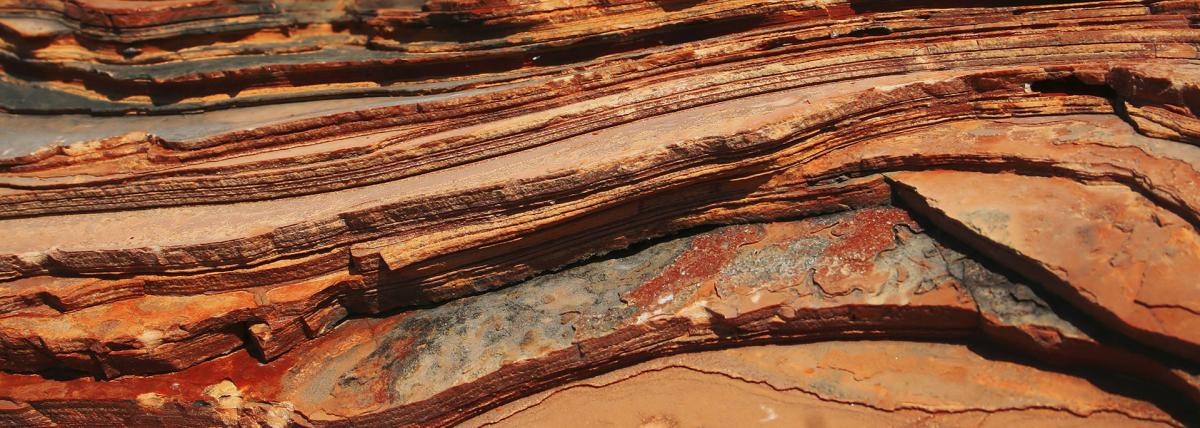
The lesson introduces how the earth layers and the fossil record shows a relative time scale. The math concept of a function will be explored. Students will use cause and effect changes of Earth
This a hands on activity that will have the students measure the frequency of a resonating glass bottle by using their cells phones. They will then combine with other groups to play a well known song
This lesson plan involves dilation and scale factors and how the human eye perceives 3D when it only uses 2D images. The hand-on activity is a perspective drawing of a city scape and teaches about