
Statistical Analysis of the Climate and Precipitation of Arizona
by Berge Jerijian
This lesson is a four day unit lesson that highlights the understanding of the climate, geography, trends in the change of temperature, and the related changes in precipitation in the state. This lesson uses data collected to create a Box and Whisker plot and use this plot to analyze the data, choose a scientific claim, and make a scientific argument to defend the choice in the claim.
Lesson Grade Level
6th GradeLesson Plan Link/URL
https://docs.google.com/presentation/d/1ut916MSZmjPisoLT0WFhaUKU6ioL74k1/edit?u…Related Content

Grades:
Kindergarten, 1st Grade, 2nd Grade
This lesson is designed for K-2 students to explore and understand weather patterns using technology. Over the course of 45 minutes, students will use tablets or computers to gather real-time weather
Grades:
3rd Grade, 4th Grade, 5th Grade, 6th Grade, 7th Grade, 8th Grade, 9th Grade
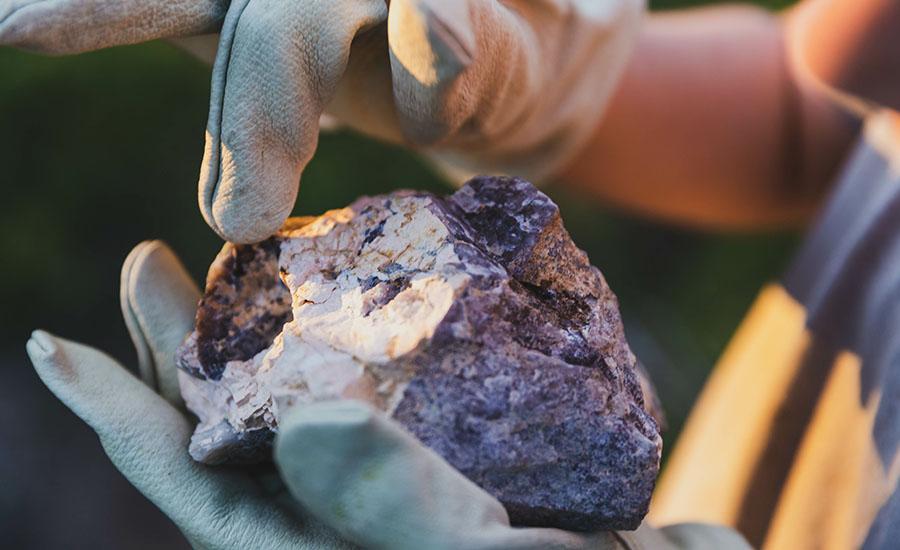
An overall view of mining, minerals, and their role in our everyday life. This lesson compares the past, present and future of mining and it's relativity to sustaining our way of life.

Grades:
6th Grade, 7th Grade, 8th Grade, 9th Grade, 10th Grade, 11th Grade, 12th Grade
This lesson is designed to encourage students to explore their interests and pursue their passions while diving into the world of STEM. This lesson takes place in a classroom for one semester. 1 hour