Statistical Analysis of the Climate and Precipitation of Arizona
by Berge Jerijian
This lesson is a four day unit lesson that highlights the understanding of the climate, geography, trends in the change of temperature, and the related changes in precipitation in the state. This lesson uses data collected to create a Box and Whisker plot and use this plot to analyze the data, choose a scientific claim, and make a scientific argument to defend the choice in the claim.
Lesson Grade Level
6th GradeLesson Plan Link/URL
https://docs.google.com/presentation/d/1ut916MSZmjPisoLT0WFhaUKU6ioL74k1/edit?u…Related Content
Grades:
6th Grade
Students will go through the process of counting pumpkin seeds and analyzing data through mean, median and mode as well as creating correlating graphs. Students will learn what causes fruit
Grades:
4th Grade
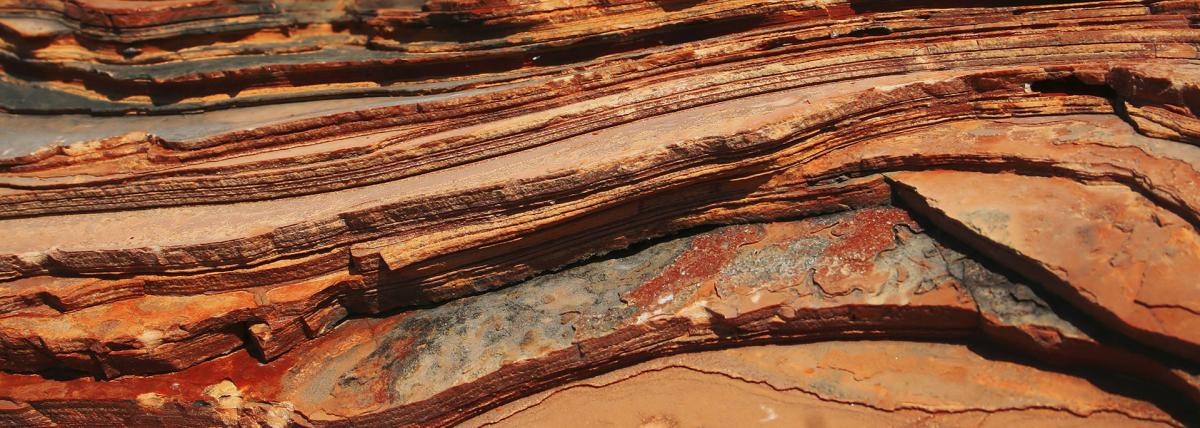
Explore Coal Mine Canyon's wonders! Watch a documentary, read about geology, draw the canyon, and use tech to learn about geological layers. Fun, interactive learning awaits!