
Grades:
4th Grade
This lesson is in collaboration with the National Park Service and contains additional activities from the Jr. Ranger program. Using the NPS brochure guide/map and Plantnet app, students will identify


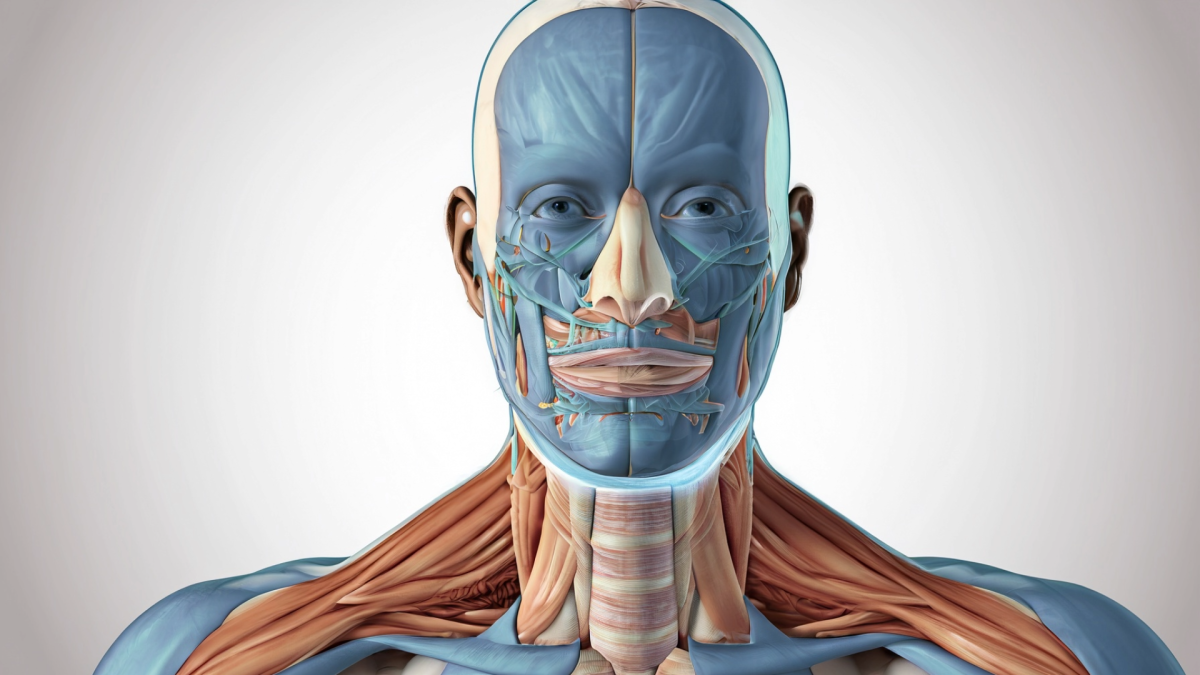
This outstanding multi-day lesson covers the anatomical design of the respiratory system. Students will work on a basic model project to simulate breathing action and the diaphragm. They will also