Using Interactive Maps and GIS to Explore the Impacts of Climate Change
by Cody Yeakel
Students use an interactive map and ArcGIS software to analyze the impacts of climate change on global populations.
Lesson Plan Link/URL
https://docs.google.com/presentation/d/15Xt3XxWNeiLdY_u1kOLeuQQAPyA6y9zE/edit?u…Related Content

Grades:
Kindergarten, 1st Grade, 2nd Grade, 3rd Grade, 4th Grade, 5th Grade, 6th Grade, 7th Grade, 8th Grade, 9th Grade, 10th Grade, 11th Grade, 12th Grade
Button makers are great additions in the classroom! But first, students should learn the history of buttons, about the button machine and how to operate it. Challenge cards provided inspire students

Grades:
6th Grade, 7th Grade, 8th Grade, 9th Grade, 10th Grade, 11th Grade, 12th Grade
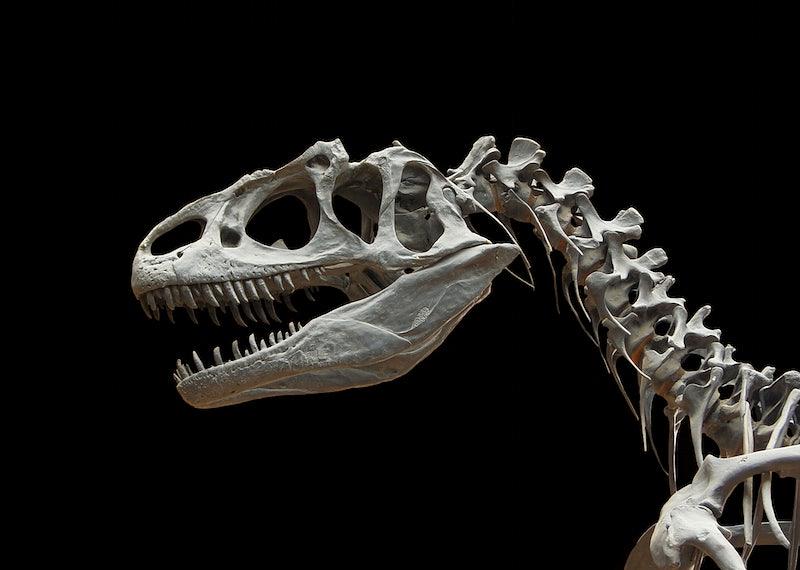
Students put together fossil bone cut outs to determine a prehistoric species before learning about the different ways scientists determine the physical characteristics of extinct organisms.

Grades:
9th Grade, 10th Grade, 11th Grade, 12th Grade
This STEM Argumentative Research Project engages students in exploring the scientific, ethical, and societal implications of themes in Mary Shelley's "Frankenstein." Students will work in groups to